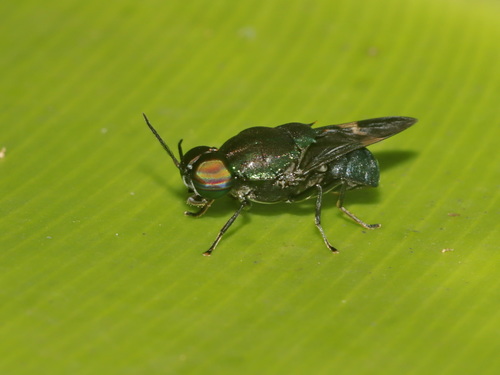
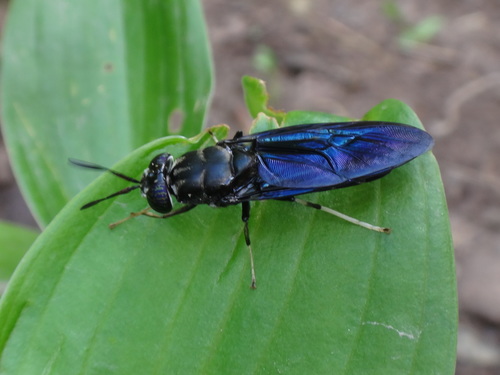
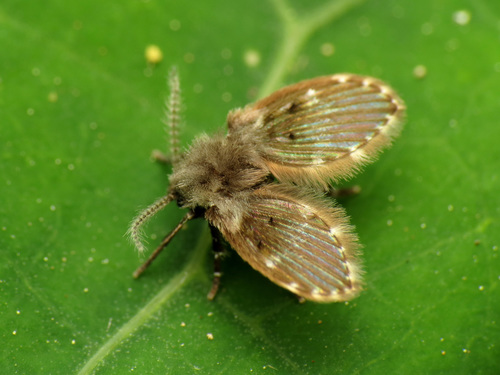
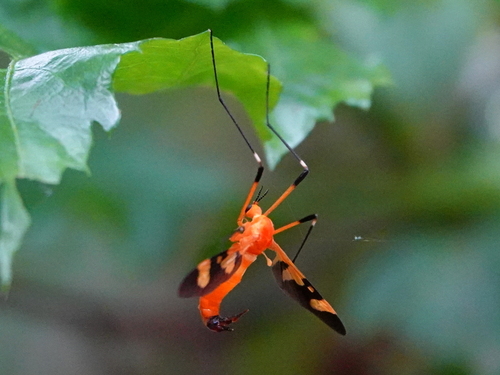
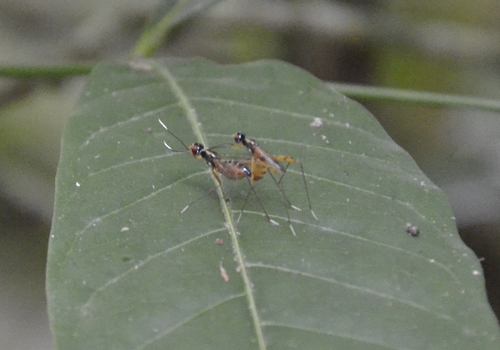
What are the chances of seeing a Ptilocera continua in Colombo [Sri Jayawardenepura Kotte]?
With luck
About 10% of wildlife watchers report a Ptilocera continua sighting in Colombo [Sri Jayawardenepura Kotte] on a given day, based on 5 verified sightings from GBIF citizen-science data. It is the 163rd most-seen of the 182 insects we can rate there. Over three days the chance rises to about 20%, and over a week to about 40%, if each day is a fresh chance.
When is the best time to see a Ptilocera continua in Colombo [Sri Jayawardenepura Kotte]?
January–March and July
In those months about 10% of wildlife watchers report a Ptilocera continua in Colombo [Sri Jayawardenepura Kotte] on a given day, against under 5% in April–June and August–December, the lowest months. Those are among Colombo [Sri Jayawardenepura Kotte]'s driest months, with about 90 mm of rain a month against 310 mm in November.
Is Colombo [Sri Jayawardenepura Kotte] the best place to see a Ptilocera continua?
Yes
Of the 3 cities where we can rate Ptilocera continua sightings, Colombo [Sri Jayawardenepura Kotte] has the highest daily chance: about 10%. Next come Mumbai (India, under 5%) and Kochi (India, under 5%).
Where does the Ptilocera continua sighting chance come from?
GBIF citizen-science records
It is estimated from how often the Ptilocera continua is recorded against all the insects logged in Colombo [Sri Jayawardenepura Kotte] (5 verified sightings), calibrated against known sighting rates. Figures are rounded to the nearest 10% because citizen-science data supports honest approximations, not decimals, and months with records from fewer than five people show "—". How it works.