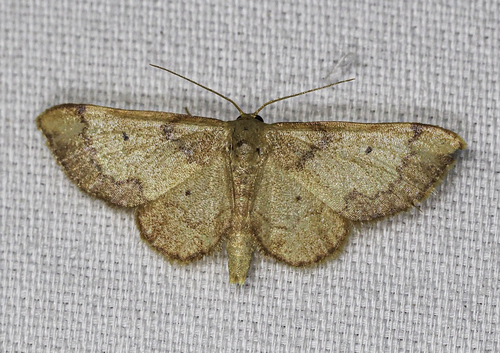
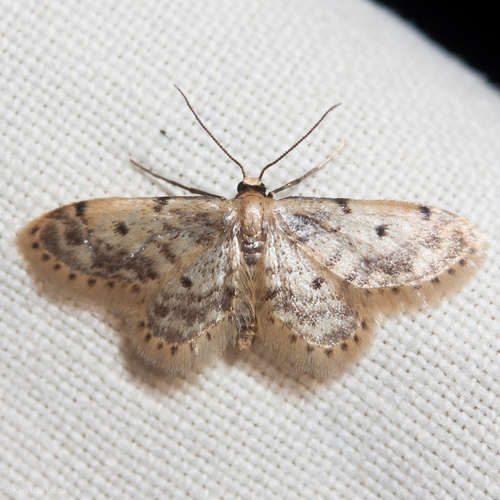
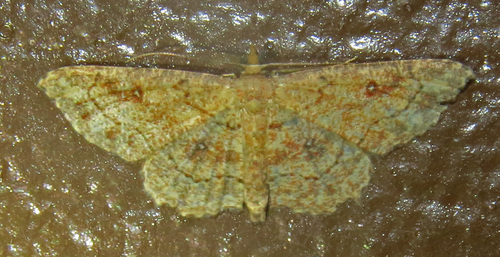
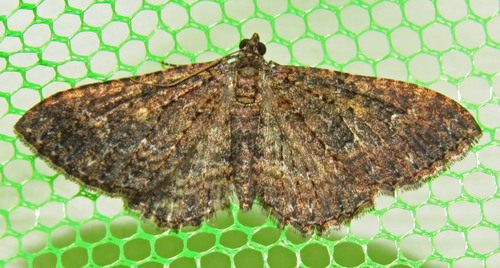
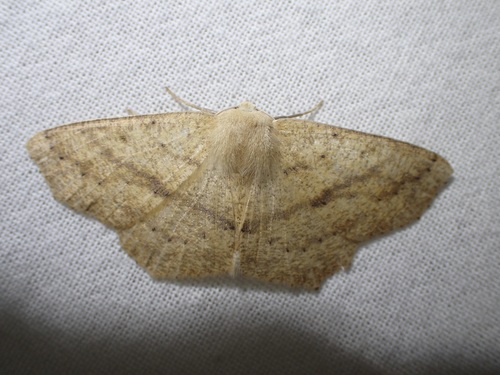
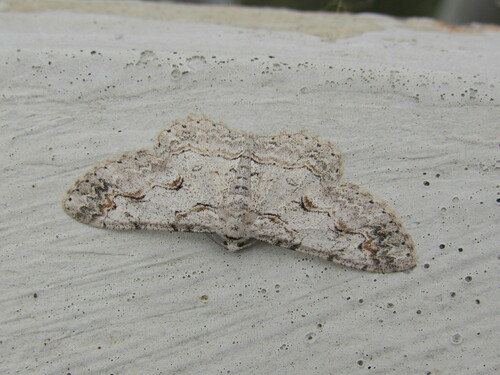
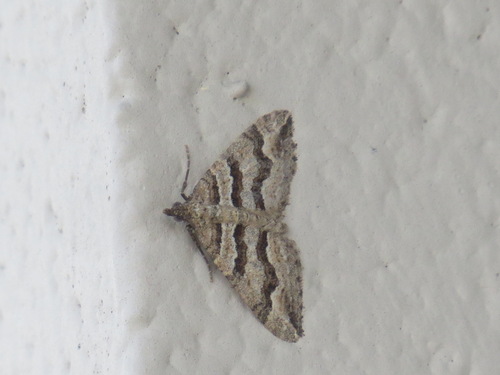
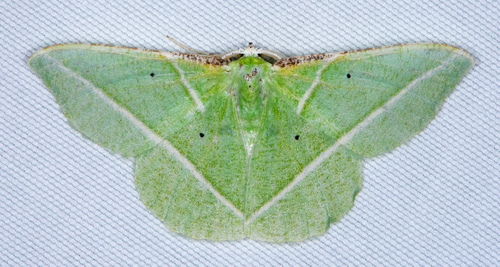
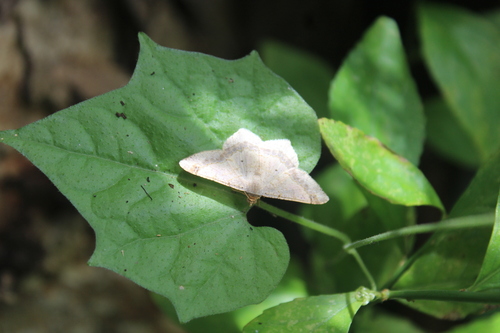
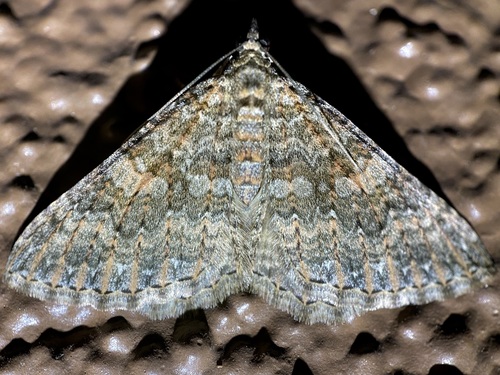
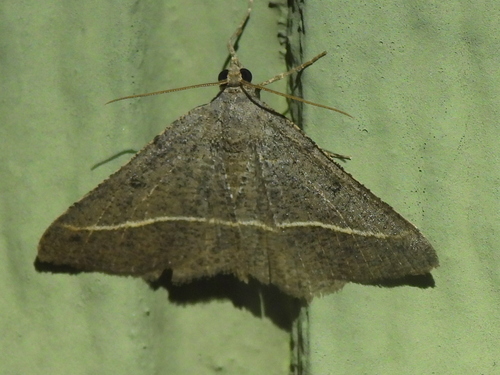
What are the chances of seeing a Red-Bordered Wave in San Diego?
Rare
Under 5% of wildlife watchers report a Red-Bordered Wave sighting in San Diego on a given day, based on 22 verified sightings from GBIF citizen-science data. It is the 314th most-seen of the 693 insects we can rate there. Over three days the chance rises to about 10%, and over a week to about 20%, if each day is a fresh chance.
When is the best time to see a Red-Bordered Wave in San Diego?
Any time of year
In every month with enough records, under 5% of wildlife watchers report a Red-Bordered Wave in San Diego on a given day, so our monthly data shows no clear season.
Where else can you see a Red-Bordered Wave?
Only San Diego, in our data
San Diego is the only city on Wallace's Line with enough records to rate Red-Bordered Wave sightings: under 5% of wildlife watchers there report one on a given day.
Where does the Red-Bordered Wave sighting chance come from?
GBIF citizen-science records
It is estimated from how often the Red-Bordered Wave is recorded against all the insects logged in San Diego (22 verified sightings), calibrated against known sighting rates. Figures are rounded to the nearest 10% because citizen-science data supports honest approximations, not decimals, and months with records from fewer than five people show "—". How it works.