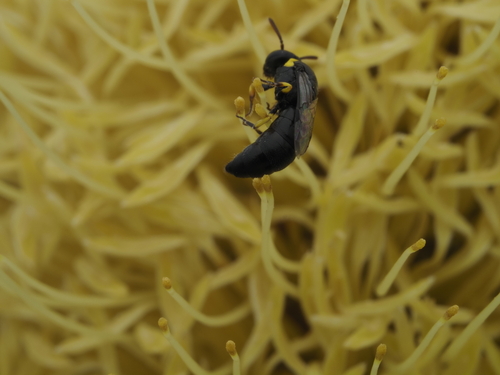
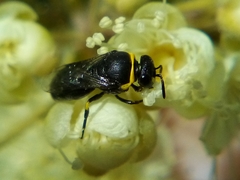
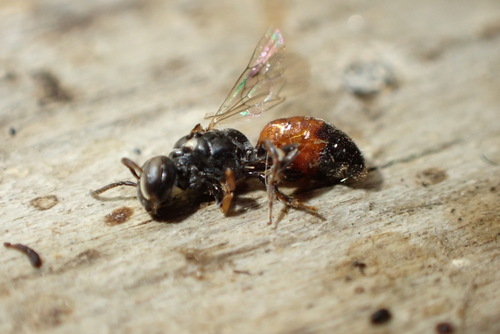
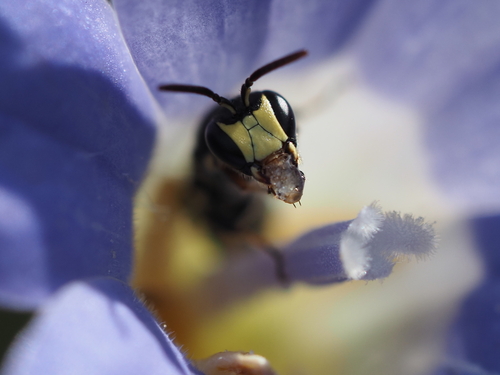
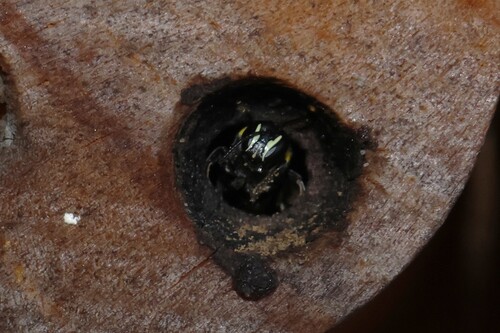
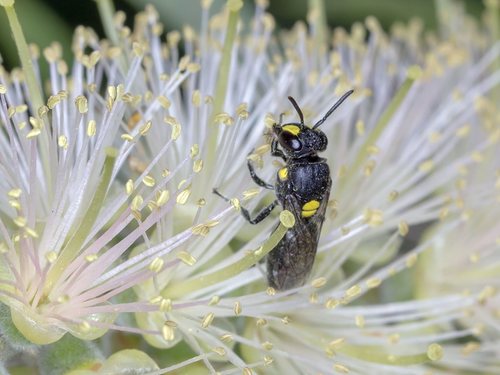
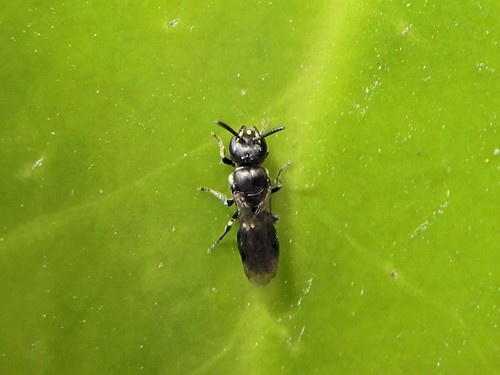
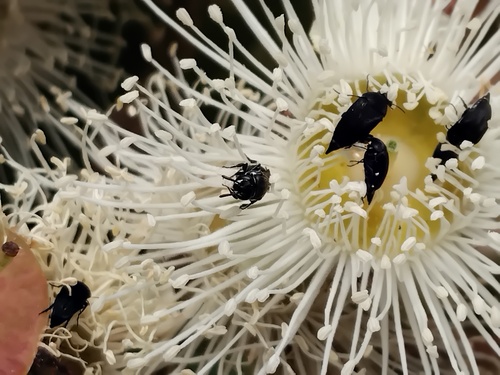
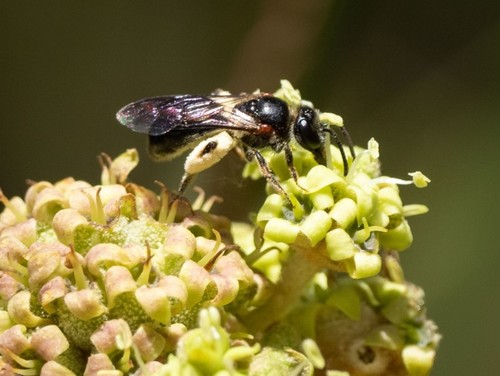
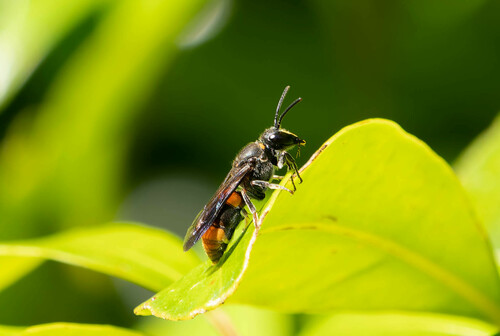
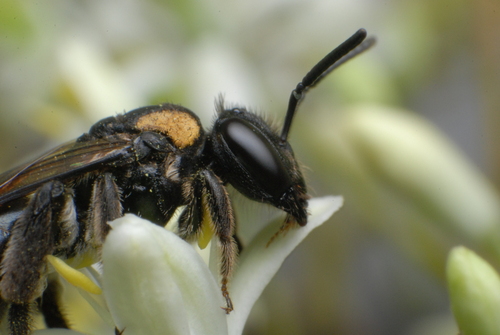
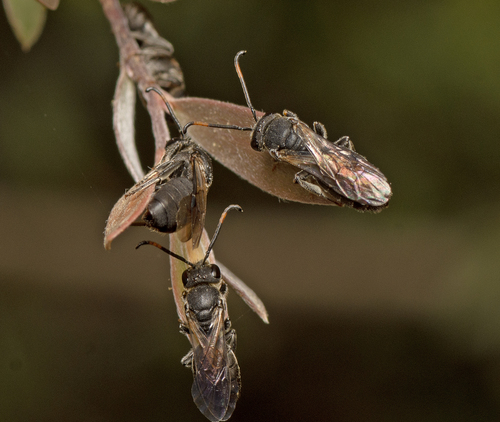
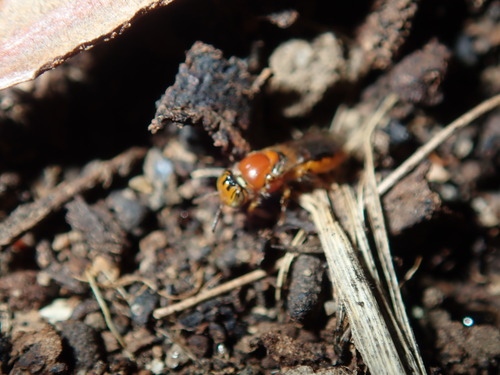
Yellow-Collared Masked Bee

Yellow-Collared Masked Bee

Hylaeus euxanthus

Daily sighting probability <5% · Rare
at Melbourne

In 3 days ~10% in a week ~20%

26 Verified sightings at Melbourne
February Best month

About the Yellow-Collared Masked Bee

Hylaeus euxanthus is a species of hymenopteran in the family Colletidae and the subgenus Gnathoprosopis. It is found in Australia. Wikipedia →

Global Distribution

Parks Where Found

# Park Country Daily sighting probability

More parks will be added in future updates.

Cities Where Found

# City Country Daily sighting probability
1 Santiago 🇨🇱 Chile
~10%
2 Perth 🇦🇺 Australia
<5%
3 Auckland 🇳🇿 New Zealand
<5%
4 Melbourne 🇦🇺 Australia
<5%
5 Brisbane 🇦🇺 Australia
<5%
6 Buenos Aires 🇦🇷 Argentina
<5%
7 Los Angeles 🇺🇸 United States
<5%

Before you go

What are the chances of seeing a Yellow-Collared Masked Bee in Melbourne?

Rare

Under 5% of wildlife watchers report a Yellow-Collared Masked Bee sighting in Melbourne on a given day, based on 26 verified sightings from GBIF citizen-science data. It is the 377th most-seen of the 875 insects we can rate there. Over three days the chance rises to about 10%, and over a week to about 20%, if each day is a fresh chance.

When is the best time to see a Yellow-Collared Masked Bee in Melbourne?

February

In that month about 10% of wildlife watchers report a Yellow-Collared Masked Bee in Melbourne on a given day, against under 5% in March to January, the lowest months.

Is Melbourne the best place to see a Yellow-Collared Masked Bee?

4th of 7

Of the 7 cities where we can rate Yellow-Collared Masked Bee sightings, Melbourne ranks 4th at under 5%. The best odds are in Santiago (Chile, about 10%), Perth (Australia, under 5%) and Auckland (New Zealand, under 5%).

Where does the Yellow-Collared Masked Bee sighting chance come from?

GBIF citizen-science records

It is estimated from how often the Yellow-Collared Masked Bee is recorded against all the insects logged in Melbourne (26 verified sightings), calibrated against known sighting rates. Figures are rounded to the nearest 10% because citizen-science data supports honest approximations, not decimals, and months with records from fewer than five people show "—". How it works.

← Back to Melbourne