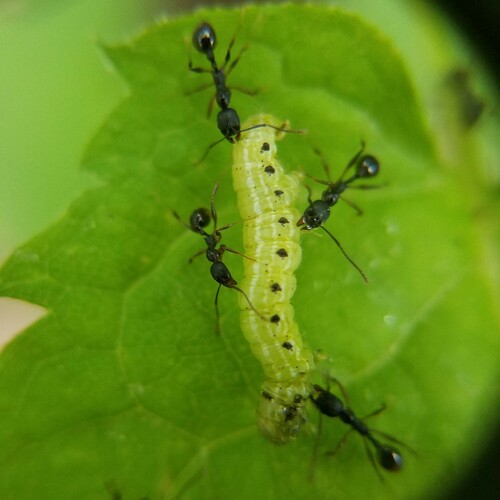
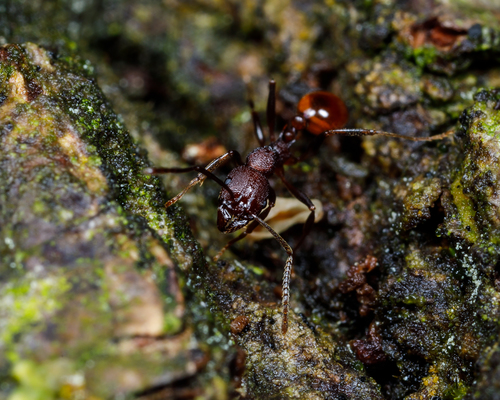
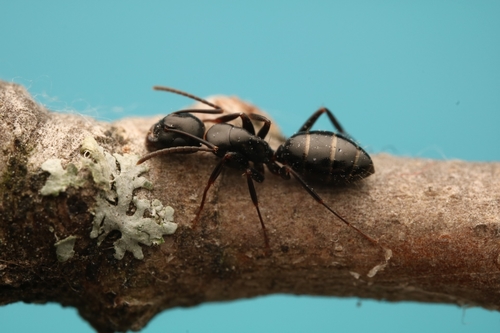
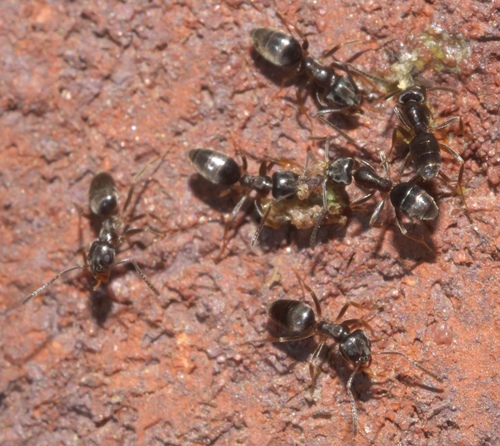
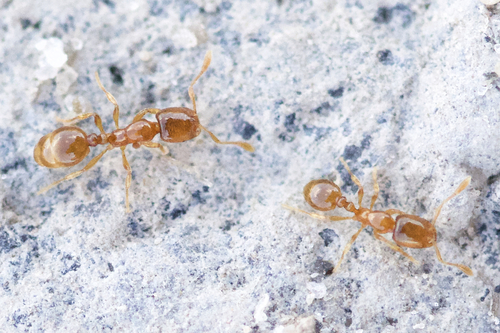
Pitch-Black Collared Ant

Pitch-Black Collared Ant

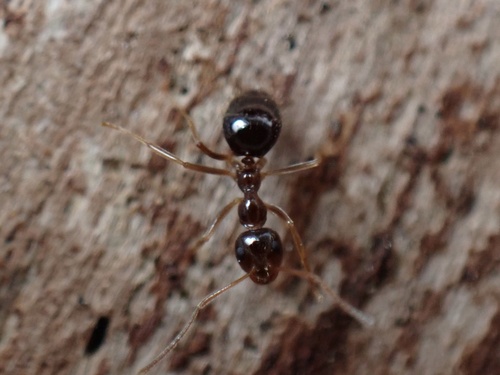
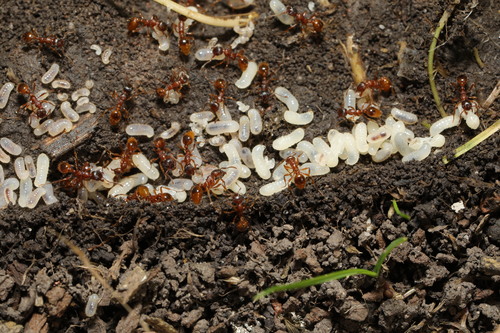
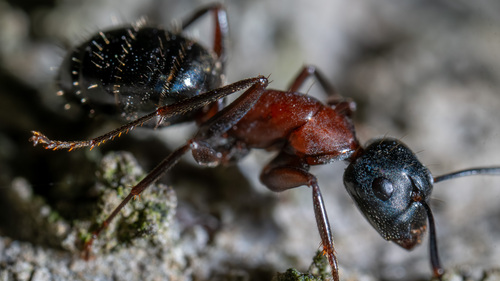
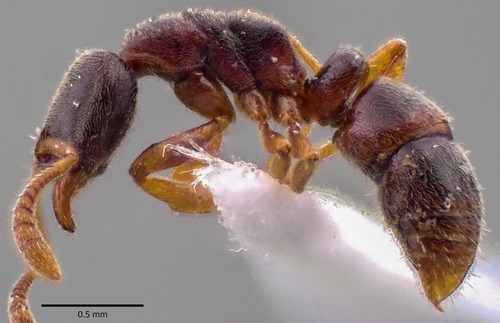
Aphaenogaster picea

Daily sighting probability <5% · Rare
at Toronto

In 3 days ~10%

8 Verified sightings at Toronto
28 In all 2 parks From 2019 to 2026
November Best month
🌅 Crepuscular When it's spotted

About the Pitch-Black Collared Ant

Aphaenogaster picea is a species of ant in the family Formicidae. Wikipedia →

Global Distribution

Parks Where Found

# Park Country Daily sighting probability
1 Great Smoky Mountains National Park 🇺🇸 United States
~10%
2 Shenandoah National Park 🇺🇸 United States
~10%

Cities Where Found

# City Country Daily sighting probability
1 Toronto 🇨🇦 Canada
<5%
2 New York City 🇺🇸 United States
<5%

Before you go

What are the chances of seeing a Pitch-Black Collared Ant in Toronto?

Rare

Under 5% of wildlife watchers report a Pitch-Black Collared Ant sighting in Toronto on a given day, based on 8 verified sightings from GBIF citizen-science data. It is the 1212th most-seen of the 1689 insects we can rate there. Over three days the chance rises to about 10%, if each day is a fresh chance.

When is the best time to see a Pitch-Black Collared Ant in Toronto?

Any time of year

In every month with enough records, under 5% of wildlife watchers report a Pitch-Black Collared Ant in Toronto on a given day, so our monthly data shows no clear season.

What time of day is best to see a Pitch-Black Collared Ant?

Between 10 am and 1 pm

Across all the parks we cover, that three-hour window holds the most Pitch-Black Collared Ant sightings with a recorded time, and about 7 in 10 of them come between 6 am and 6 pm: it is most active around dawn and dusk.

Is Toronto the best place to see a Pitch-Black Collared Ant?

Yes

Of the 2 cities where we can rate Pitch-Black Collared Ant sightings, Toronto has the highest daily chance: under 5%. Next come New York City (United States, under 5%).

Where does the Pitch-Black Collared Ant sighting chance come from?

GBIF citizen-science records

It is estimated from how often the Pitch-Black Collared Ant is recorded against all the insects logged in Toronto (8 verified sightings), calibrated against known sighting rates. Figures are rounded to the nearest 10% because citizen-science data supports honest approximations, not decimals, and months with records from fewer than five people show "—". How it works.

← Back to Toronto