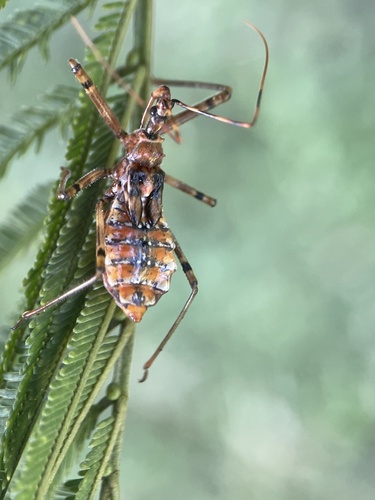
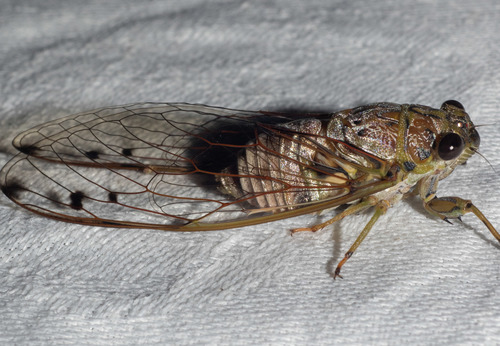
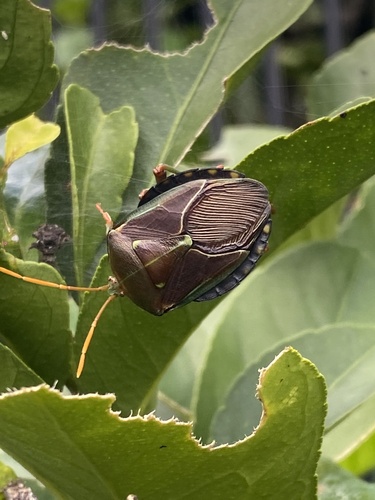
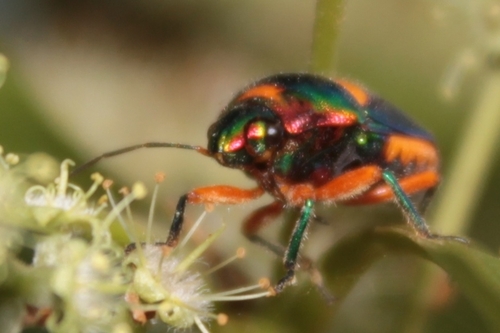
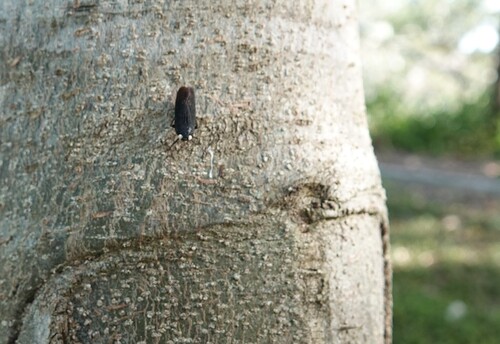
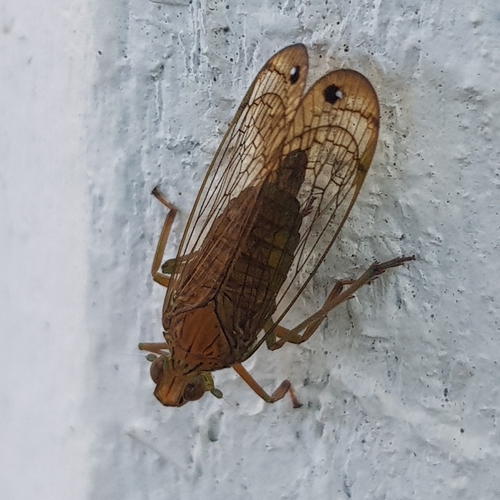
🦋

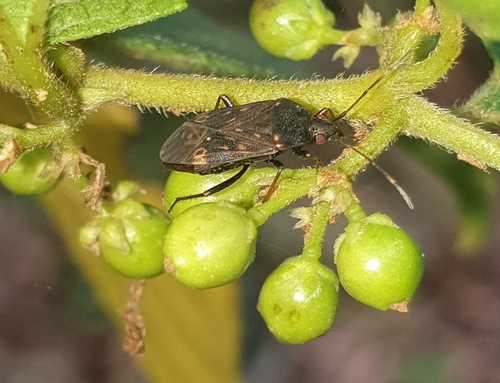
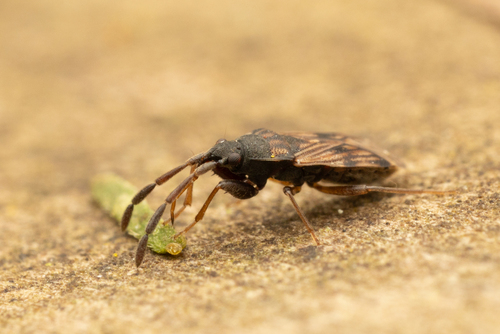
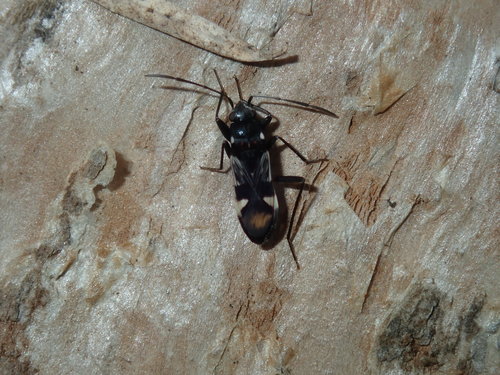
Remaudiereana inornatus

Remaudiereana inornatus

Daily sighting probability <5% · Rare
at Brisbane

In 3 days ~10% in a week ~20%

8 Verified sightings at Brisbane
April Best month

Global Distribution

Parks Where Found

# Park Country Daily sighting probability

More parks will be added in future updates.

Cities Where Found

# City Country Daily sighting probability
1 Perth 🇦🇺 Australia
~10%
2 Melbourne 🇦🇺 Australia
<5%
3 Auckland 🇳🇿 New Zealand
<5%
4 Brisbane 🇦🇺 Australia
<5%

Before you go

What are the chances of seeing a Remaudiereana inornatus in Brisbane?

Rare

Under 5% of wildlife watchers report a Remaudiereana inornatus sighting in Brisbane on a given day, based on 8 verified sightings from GBIF citizen-science data. It is the 806th most-seen of the 1083 insects we can rate there. Over three days the chance rises to about 10%, and over a week to about 20%, if each day is a fresh chance.

When is the best time to see a Remaudiereana inornatus in Brisbane?

Any time of year

In every month with enough records, under 5% of wildlife watchers report a Remaudiereana inornatus in Brisbane on a given day, so our monthly data shows no clear season.

Is Brisbane the best place to see a Remaudiereana inornatus?

4th of 4

Of the 4 cities where we can rate Remaudiereana inornatus sightings, Brisbane ranks 4th at under 5%. The best odds are in Perth (Australia, about 10%), Melbourne (Australia, under 5%) and Auckland (New Zealand, under 5%).

Where does the Remaudiereana inornatus sighting chance come from?

GBIF citizen-science records

It is estimated from how often the Remaudiereana inornatus is recorded against all the insects logged in Brisbane (8 verified sightings), calibrated against known sighting rates. Figures are rounded to the nearest 10% because citizen-science data supports honest approximations, not decimals, and months with records from fewer than five people show "—". How it works.

← Back to Brisbane