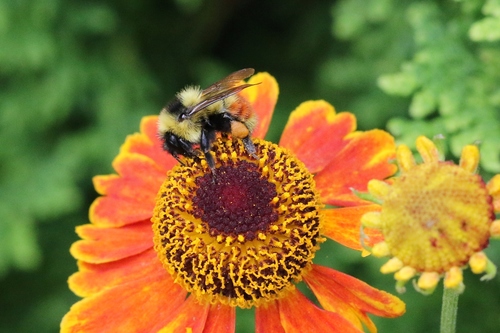
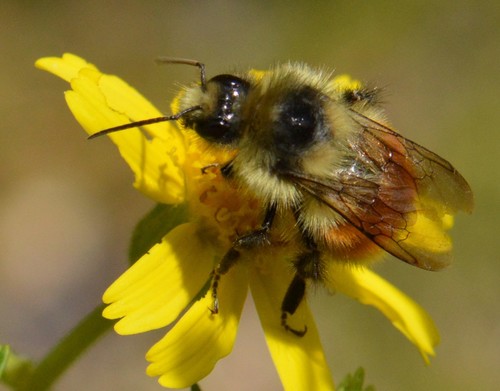
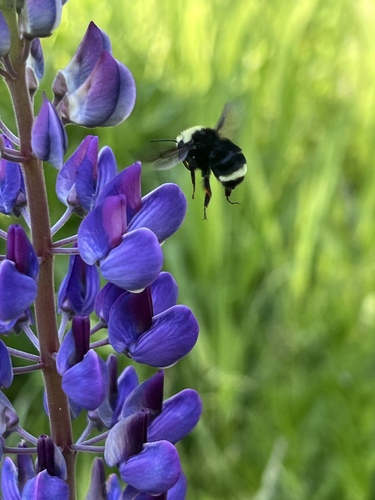
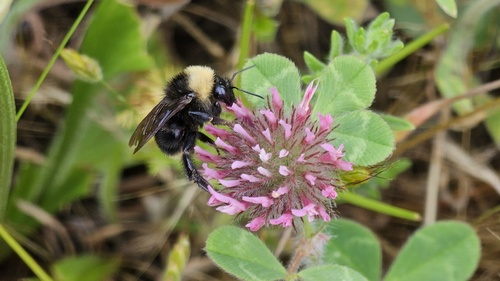
Red-Belted Bumble Bee

Red-Belted Bumble Bee

Bombus rufocinctus

Daily sighting probability <5% · Rare
at San Francisco

In 3 days ~10% in a week ~20%

41 Verified sightings at San Francisco
135 In all 4 parks From 2019 to 2026
June Best month
☀️ Diurnal When it's spotted

About the Red-Belted Bumble Bee

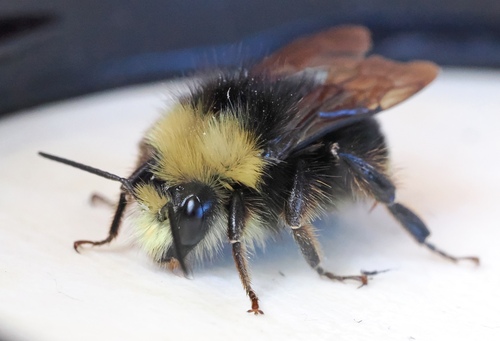
Bombus rufocinctus is a species of bumblebee known commonly as the "red-belted bumblebee". It is native to North America where it has a wide distribution across Canada and the western, midwestern, and northeastern United States. It may occur in Mexico.

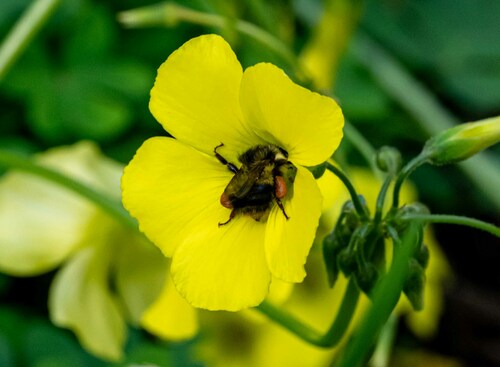
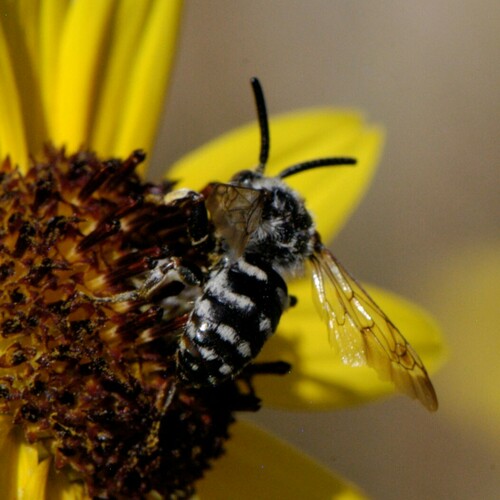
The queen is 1.6 to 1.8 centimeters long and just under a centimeter wide at the abdomen. It is black with scattered gray and yellowish hairs on the head. The abdomen has many bright yellow hairs and areas of reddish hairs. The worker is 1.1 to 1.2 centimeters long and half a centimeter wide at the abdomen. It is similar to the queen but it may have longer hairs. The male is 1.2 to 1.3 centimeters long and half a centimeter wide at the abdomen. It is mostly black with more yellow on the head and abdomen. This species displays four genetically controlled color polymorphisms: the second and third abdominal terga may have red or black hairs, and the fourth and fifth may be either yellow or black.

This small, short-tongued bee lives in and around wooded areas and it can be found in urban parks and gardens. It feeds on several kinds of plants, including chicories, snakeroots, strawberries, gumweeds, sunflowers, goldenrods, clovers, vetches, and goldeneyes. It usually nests on or above ground level. Wikipedia →

Global Distribution

Parks Where Found

# Park Country Daily sighting probability
1 Grand Teton National Park 🇺🇸 United States
~10%
2 Yellowstone National Park 🇺🇸 United States
~10%
3 Rocky Mountain National Park 🇺🇸 United States
~10%
4 Glacier National Park 🇺🇸 United States
~10%

Cities Where Found

# City Country Daily sighting probability
1 Minneapolis [Saint Paul] 🇺🇸 United States
~30%
2 Calgary 🇨🇦 Canada
~20%
3 Toronto 🇨🇦 Canada
~20%
4 Edmonton 🇨🇦 Canada
~20%
5 Montreal 🇨🇦 Canada
~10%
6 Vancouver 🇨🇦 Canada
<5%
7 San Francisco 🇺🇸 United States
<5%
8 Chicago 🇺🇸 United States
<5%

Before you go

What are the chances of seeing a Red-Belted Bumble Bee in San Francisco?

Rare

Under 5% of wildlife watchers report a Red-Belted Bumble Bee sighting in San Francisco on a given day, based on 41 verified sightings from GBIF citizen-science data. It is the 295th most-seen of the 737 insects we can rate there. Over three days the chance rises to about 10%, and over a week to about 20%, if each day is a fresh chance.

When is the best time to see a Red-Belted Bumble Bee in San Francisco?

Any time of year

In every month with enough records, under 5% of wildlife watchers report a Red-Belted Bumble Bee in San Francisco on a given day, so our monthly data shows no clear season.

What time of day is best to see a Red-Belted Bumble Bee?

Between 1 and 4 pm

Across all the parks we cover, that three-hour window holds the most Red-Belted Bumble Bee sightings with a recorded time, and about 9 in 10 of them come between 6 am and 6 pm: it is a daytime animal.

Is San Francisco the best place to see a Red-Belted Bumble Bee?

7th of 8

Of the 8 cities where we can rate Red-Belted Bumble Bee sightings, San Francisco ranks 7th at under 5%. The best odds are in Minneapolis [Saint Paul] (United States, about 30%), Calgary (Canada, about 20%) and Toronto (Canada, about 20%).

Which relatives of the Red-Belted Bumble Bee live in San Francisco?

Same genus: Bombus

The closest relatives of the Red-Belted Bumble Bee that you can see in San Francisco (genus Bombus, Bumble Bees) are Black-Tailed Bumble Bee (about 10%) and Yellow-Faced Bumble Bee (about 10%), with each one's daily chance of a sighting.

Where does the Red-Belted Bumble Bee sighting chance come from?

GBIF citizen-science records

It is estimated from how often the Red-Belted Bumble Bee is recorded against all the insects logged in San Francisco (41 verified sightings), calibrated against known sighting rates. Figures are rounded to the nearest 10% because citizen-science data supports honest approximations, not decimals, and months with records from fewer than five people show "—". How it works.

← Back to San Francisco