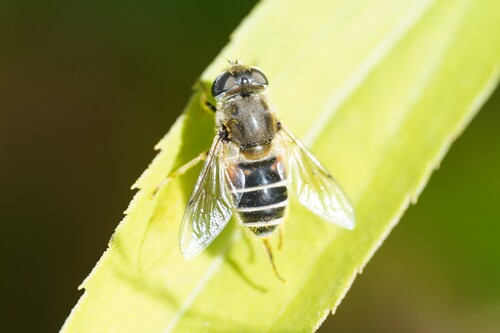
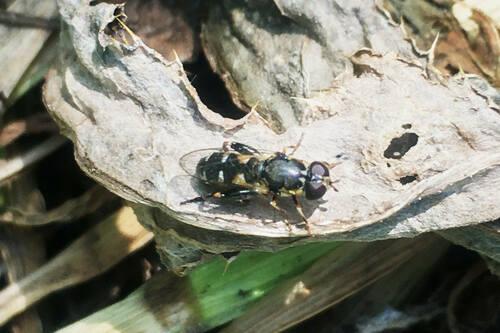
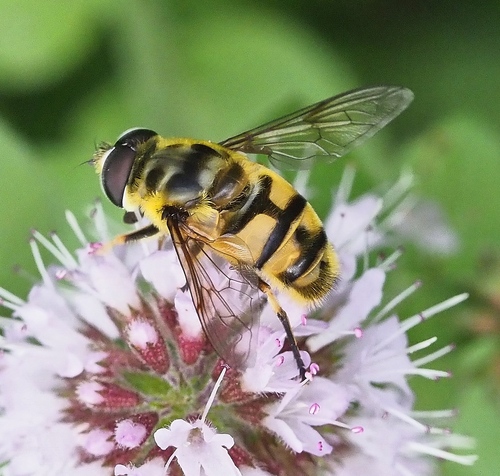
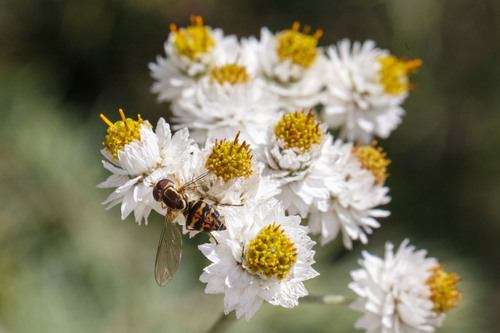
What are the chances of seeing a Vagabond Cluster Fly in Vancouver?
Rare
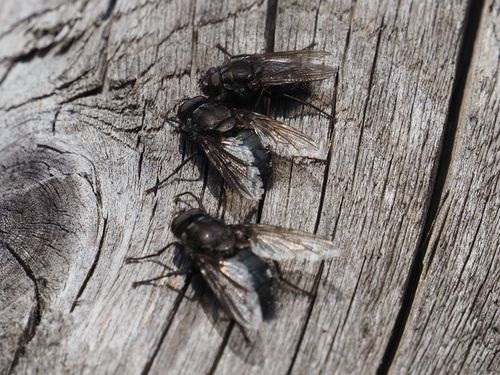
Under 5% of wildlife watchers report a Vagabond Cluster Fly sighting in Vancouver on a given day, based on 25 verified sightings from GBIF citizen-science data. It is the 200th most-seen of the 482 insects we can rate there. Over three days the chance rises to about 10%, and over a week to about 20%, if each day is a fresh chance.
When is the best time to see a Vagabond Cluster Fly in Vancouver?
February and March
In those months about 10% of wildlife watchers report a Vagabond Cluster Fly in Vancouver on a given day, against under 5% in April to January, the lowest months.
Is Vancouver the best place to see a Vagabond Cluster Fly?
2nd of 6
Of the 6 cities where we can rate Vagabond Cluster Fly sightings, Vancouver ranks 2nd at under 5%. The best odds are in Helsinki (Finland, about 10%).
Which relatives of the Vagabond Cluster Fly live in Vancouver?
Same order: Diptera
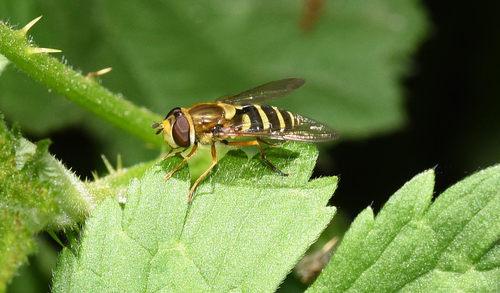
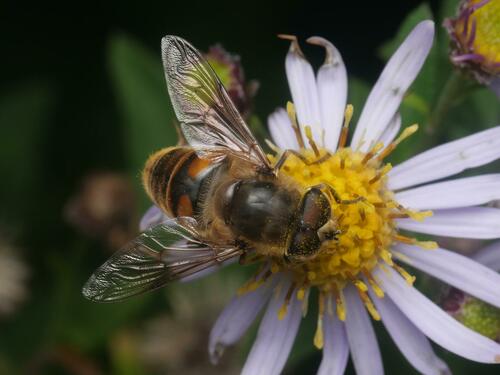
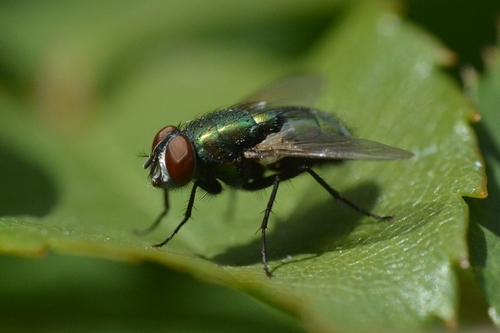
The closest relatives of the Vagabond Cluster Fly that you can see in Vancouver (order Diptera, Flies) are Black-Margined Flower Fly (about 10%), Common Drone Fly (about 10%) and Common European Greenbottle Fly (about 10%), with each one's daily chance of a sighting.
Where does the Vagabond Cluster Fly sighting chance come from?
GBIF citizen-science records
It is estimated from how often the Vagabond Cluster Fly is recorded against all the insects logged in Vancouver (25 verified sightings), calibrated against known sighting rates. Figures are rounded to the nearest 10% because citizen-science data supports honest approximations, not decimals, and months with records from fewer than five people show "—". How it works.