City
Lubango
🇦🇴 Angola
Africa, Angola 138 spp. recorded
14.893° S 13.529° E
🦜 Nature

138 Species sighted
610 Verified sightings From 2019 to 2026
Feb Best month
⭐ Iconic Species


📊 Most Spotted






📊 Most Spotted
LC
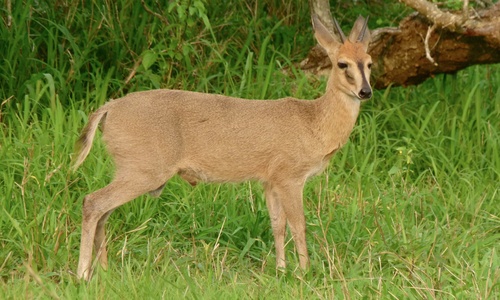
 Bush Duiker
Sylvicapra grimmia

LC
 Malbrouck Monkey
Chlorocebus cynosuros
LC
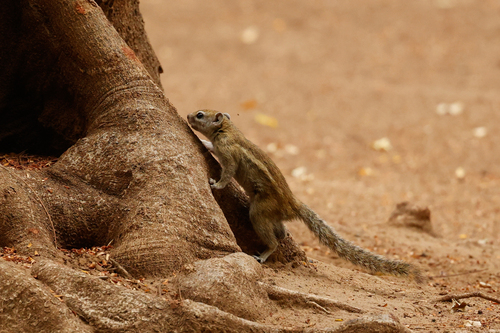
 Congo Rope Squirrel
Funisciurus congicus

LC
 Cape Porcupine
Hystrix africaeaustralis
⭐ Iconic Species
📊 Most Spotted
📊 Most Spotted

LC
 Kalahari Tree Skink
Trachylepis spilogaster
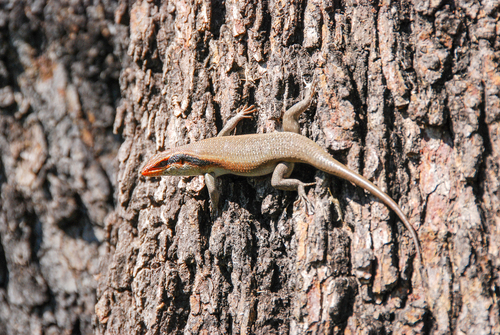
Wahlberg’s Striped Skink
Trachylepis wahlbergii

LC
 Namib Rock Agama
Agama planiceps

LC
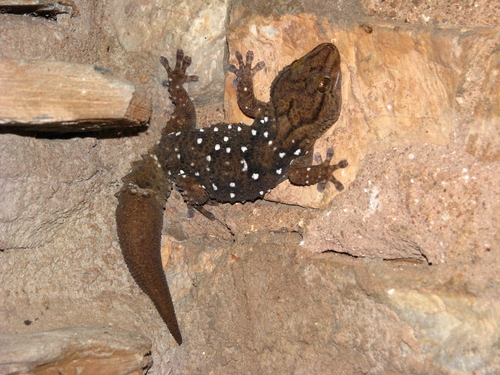
 Tropical House Gecko
Hemidactylus mabouia
LC
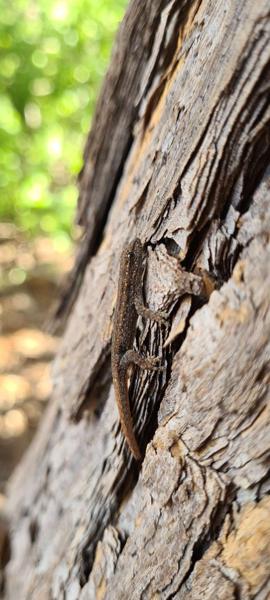
 Fischer's Thick-toed Gecko
Chondrodactylus laevigatus
LC
 Bradfield's Dwarf Gecko
Lygodactylus bradfieldi
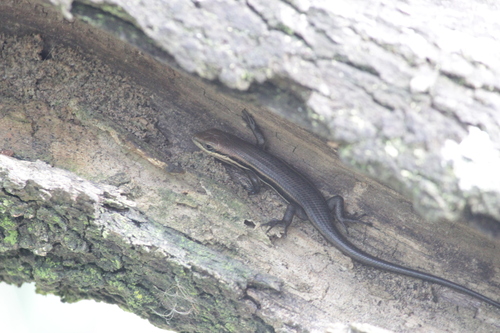
Angolan Variable Skink
Trachylepis albopunctata
📊 Most Spotted

LC
Peters's Platanna
Xenopus petersii
📊 Most Spotted
🌙 Most active after dark


LC
Tropical House Gecko
Hemidactylus mabouia
LC
Fischer's Thick-toed Gecko
Chondrodactylus laevigatus

LC
 Spotted Eagle-Owl
Bubo africanus
LC
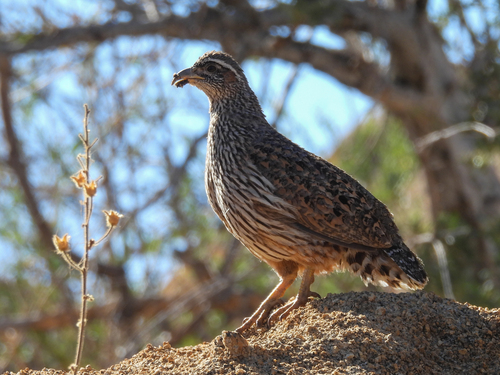
 Hartlaub's Francolin
Pternistis hartlaubi

LC
 Fiery-necked Nightjar
Caprimulgus pectoralis
Recent sightings in Lubango
LIVEiNaturalistSighting Calendar
How many species you'd see in a day
4.2Jan
6Feb
4.4Mar
—
No data
Apr—
No data
May0.7Jun
3.8Jul
3.5Aug
4.5Sep
5.6Oct
0.1Nov
0.2Dec
🏙️ City
Essentials
Green cover
Low
Protected land
—
Protected sea
—
Protected areas
—
Wildlife spots
0
spotsZoos & centres
1
placesClimate
Subtropical highland
World Heritage
No
Climate
Temp °C Rain mm
JanFebMarAprMayJunJulAugSepOctNovDec
Zoos & rescue centres

0.0 Good
Wallace's Line Score
How good is this city for seeing wildlife? 🦜
Biodiversity
GoodHow rich is the wildlife?
3.7
Species by taxon
🦅 Birds 476
🐒 Mammals 116
🦎 Reptiles 100
🐸 Amphibians 23
715 Total Species
679 Global average across 380 cities
17 Threatened 0 Endemic
🔭
Sighting
GoodHow likely to see animals?
3.0
🎯
Top-12 Avg Probability
42% 📊
Coverage (50 species at ≥5% of 715 in the inventory)
7% 🔀
Taxon variety in top 12 (4 mammal, 4 reptile, 4 bird)
89% 🌟
Iconic-group species (≥15%) (every species from the 19 iconic groups — monkeys, cats, toucans, macaws, sloths, crocodilians… — not just the 4 highlighted above)
3 ⭐
High-prob species (>40%)
6 🏕️
Experience
GoodHow easy and pleasant is the visit?
3.2
Climate Pleasant High
Green cover Low Low
Protected land & sea — Low
Protected areas 0 Low
Wildlife spots 0 Low
Zoos & centres 1 Medium
What visitors say
Before you go
What animals can you see in Lubango?
138 species
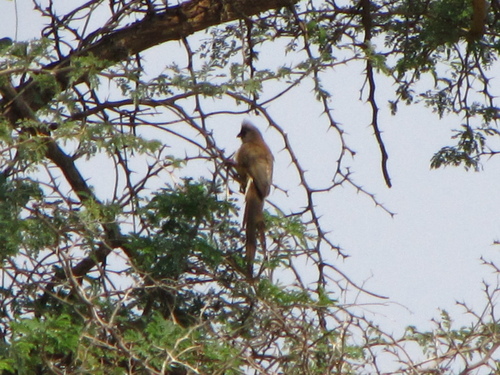
Lubango's urban area has 138 recorded vertebrate species. The ones wildlife watchers report most often on a given day are Pied Crow (about 40%), Red-backed Mousebird (about 30%), Common Bulbul (about 30%), African Palm-Swift (about 30%) and Blue-breasted Cordonbleu (about 20%).
When is the best time to see wildlife in Lubango?
February
In that month the city's 12 most-seen species average about 30% on a given day, against about 10% in August. That is one of Lubango's wettest months, with about 140 mm of rain against almost none in June.
Can you see a Red-backed Mousebird in Lubango?
Yes
About 30% of wildlife watchers report a Red-backed Mousebird sighting in Lubango on a given day, based on 32 verified sightings from GBIF citizen-science data from 2019 to 2026. The best time is February and March (about 40%).
Can you see a Hartlaub's Babbler in Lubango?
Yes
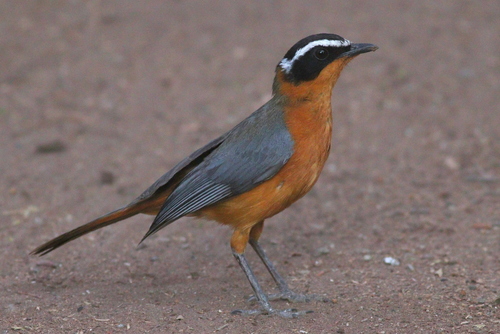
About 20% of wildlife watchers report a Hartlaub's Babbler sighting in Lubango on a given day, based on 19 verified sightings from GBIF citizen-science data from 2019 to 2026. The best time is September (about 40%).
Can you see a Pied Crow in Lubango?
Yes
About 40% of wildlife watchers report a Pied Crow sighting in Lubango on a given day, based on 39 verified sightings from GBIF citizen-science data from 2019 to 2026. The best time is October (about 60%).
Is Lubango good for wildlife watching?
3.2 out of 5
On the Wallace's Line Score, which rates each city against other cities, Lubango gets 3.2/5: 344th of 380 cities worldwide and 37th in Africa. 1 of its species is reported by about 40% or more of wildlife watchers on a given day.
Nearest Cities


Nearest Parks


Nearest Zoos & Centres


Sources: urban area GHSL Urban Centre Database R2024A, European Commission JRC (CC BY 4.0) · protected land WDPA, UNEP-WCMC & IUCN (via GHSL) · climate NASA POWER · wildlife GBIF.org citizen-science data