Vivid Dancer
Daily sighting probability ~10% · With luck
at Yellowstone National Park

In 3 days ~30% in a week ~50%

40 Verified sightings at Yellowstone National Park From 2019 to 2026
287 In all 9 parks
July Best month
☀️ Diurnal When it's spotted

About the Vivid Dancer

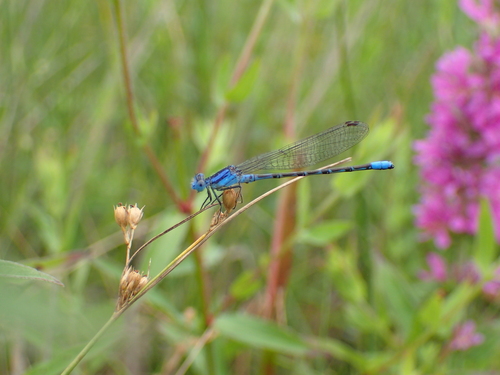
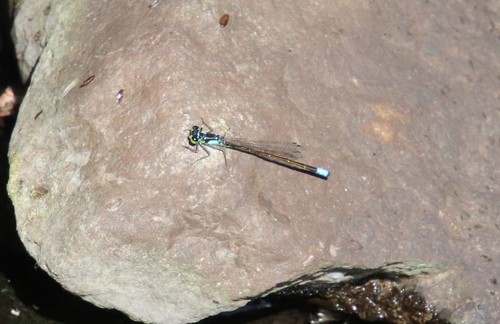
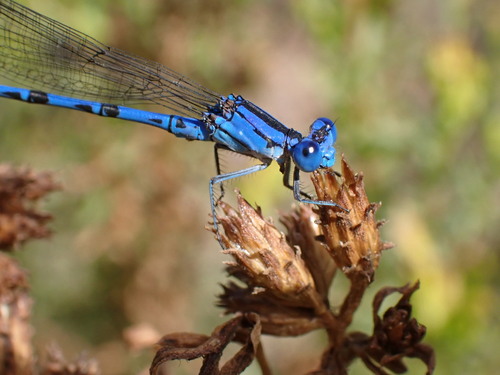
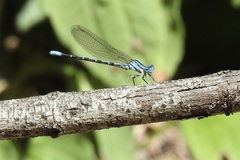
Argia vivida, the vivid dancer, is a species of narrow-winged damselfly in the family Coenagrionidae. This species is commonly found in springs and forests of Central America and North America. Argia vivida inhabit areas of diverse temperatures due to thermoregulation. The species is also considered the state insect of Nevada.

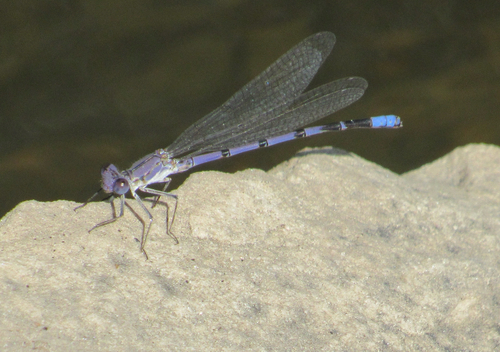
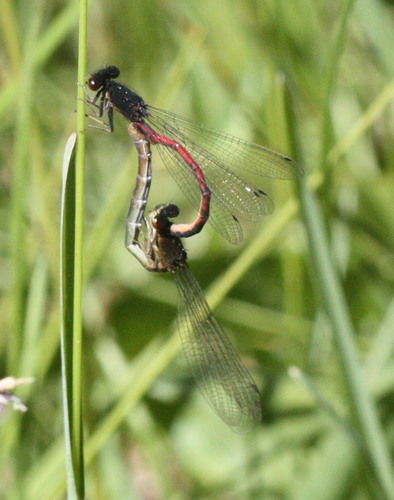
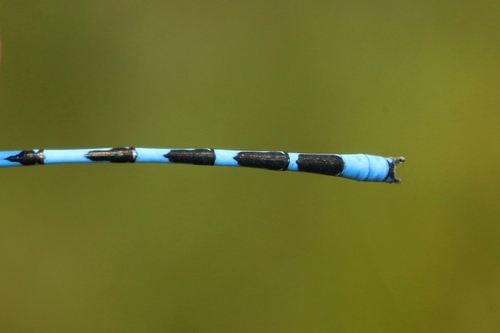
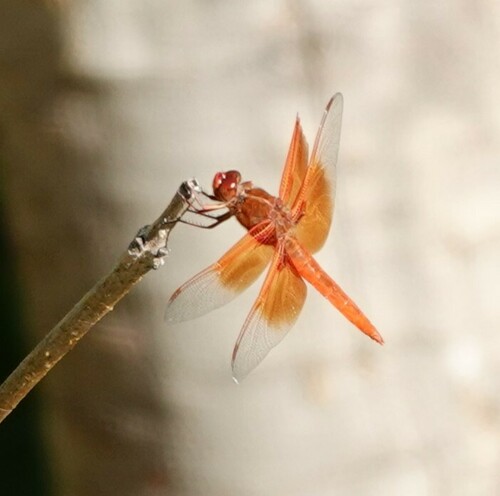
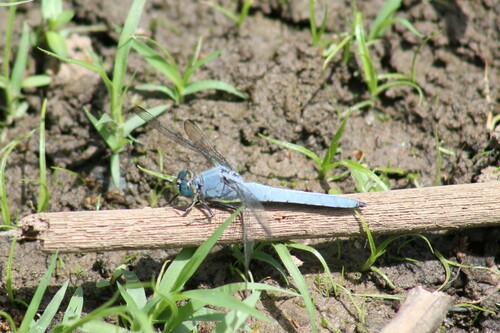
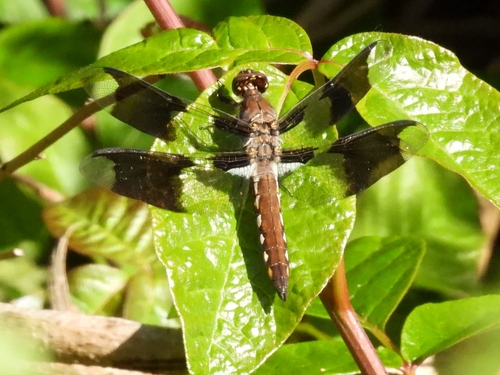
Argia vivida vary in color, although they are typically associated with the bright blue coloration. Other variations include red, brown, or grey depending on the type of morph and temperature. Mating occurs in mornings and afternoons, and eggs are oviposited just below the surface of the water. Larvae and adults feed on larvae from small invertebrates and small flying insects, respectively.

The IUCN conservation status of Argia vivida is "LC", least concern, with no immediate threat to the species' population. The population is stable. Female dimorphism occurs in two populations of Argia vivida from British Columbia, Canada. They are described as varying from a blue color morph and red color morph. Physiological color changes occur in males and both female morphs as a result of changing temperatures throughout the day. The two phases of color... Wikipedia →
Global Distribution

Parks Where Found

# Park Country Daily sighting probability
1 Death Valley National Park 🇺🇸 United States
~30%
2 Zion National Park 🇺🇸 United States
~30%
3 Sequoia and Kings Canyon National Parks 🇺🇸 United States
~10%
4 Grand Canyon National Park 🇺🇸 United States
~10%
5 Yellowstone National Park 🇺🇸 United States
~10%
6 Channel Islands National Park 🇺🇸 United States
~10%
7 Banff National Park 🇨🇦 Canada
~10%
8 Yosemite National Park 🇺🇸 United States
~10%
9 Redwood National Park 🇺🇸 United States
~10%

Cities Where Found

# City Country Daily sighting probability
1 San Francisco 🇺🇸 United States
~10%
2 San Diego 🇺🇸 United States
~10%
3 Portland 🇺🇸 United States
~10%
4 Sacramento 🇺🇸 United States
~10%
5 Salt Lake City 🇺🇸 United States
~10%
6 Los Angeles 🇺🇸 United States
~10%
7 Denver 🇺🇸 United States
~10%
8 Las Vegas 🇺🇸 United States
~10%

Before you go

What are the chances of seeing a Vivid Dancer in Yellowstone National Park?

With luck

About 10% of wildlife watchers report a Vivid Dancer sighting in Yellowstone National Park on a given day, based on 40 verified sightings from GBIF citizen-science data from 2019 to 2026. It is the 28th most-seen of the 160 insects we can rate there. Over three days the chance rises to about 30%, and over a week to about 50%, if each day is a fresh chance.

When is the best time to see a Vivid Dancer in Yellowstone National Park?

July

In that month about 20% of wildlife watchers report a Vivid Dancer in Yellowstone National Park on a given day, against under 5% in October to May, the lowest months. That is one of Yellowstone National Park's driest months, with about 30 mm of rain against 70 mm in February.

What time of day is best to see a Vivid Dancer?

Between 11 am and 2 pm

Across all the parks we cover, that three-hour window holds the most Vivid Dancer sightings with a recorded time, and about 9 in 10 of them come between 6 am and 6 pm: it is a daytime animal.

Where does the Vivid Dancer sighting chance come from?

GBIF citizen-science records

It is estimated from how often the Vivid Dancer is recorded against all the insects logged in Yellowstone National Park (40 verified sightings from 2019 to 2026), calibrated against known sighting rates. Figures are rounded to the nearest 10% because citizen-science data supports honest approximations, not decimals, and months with records from fewer than five people show "—". How it works.

← Back to Yellowstone National Park