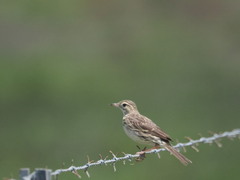
What are the chances of seeing an Australian Pipit in Uluru-Kata Tjuta National Park?
With luck
About 10% of wildlife watchers report an Australian Pipit sighting in Uluru-Kata Tjuta National Park on a given day, based on 46 verified sightings from GBIF citizen-science data from 2019 to 2026. It is the 36th most-seen of the 84 birds we can rate there. Over three days the chance rises to about 40%, and over a week to about 70%, if each day is a fresh chance.
When is the best time to see an Australian Pipit in Uluru-Kata Tjuta National Park?
January, March–April and June–August
In those months about 20% of wildlife watchers report an Australian Pipit in Uluru-Kata Tjuta National Park on a given day, against about 10% in February, May and September–December, the lowest months.
What time of day is best to see an Australian Pipit?
Between 9 am and noon
Across all the parks we cover, that three-hour window holds the most Australian Pipit sightings with a recorded time, and nearly all of them come between 6 am and 6 pm: it is a daytime animal.
Is Uluru-Kata Tjuta National Park the best place to see an Australian Pipit?
6th of 16
Of the 16 parks where we can rate Australian Pipit sightings, Uluru-Kata Tjuta National Park ranks 6th at about 10%. The best odds are in Maria Island National Park (Australia, about 30%), Flinders Ranges National Park (Australia, about 20%) and Ningaloo Marine Park (Australia, about 20%).
Which relatives of the Australian Pipit live in Uluru-Kata Tjuta National Park?
Same order: Passeriformes
The closest relatives of the Australian Pipit that you can see in Uluru-Kata Tjuta National Park (order Passeriformes, Perching Birds) are White-plumed Honeyeater (about 90%), Willie Wagtail (about 80%) and Zebra Finch (about 70%), with each one's daily chance of a sighting.
Where does the Australian Pipit sighting chance come from?
GBIF citizen-science records
It is estimated from how often the Australian Pipit is recorded against all the birds logged in Uluru-Kata Tjuta National Park (46 verified sightings from 2019 to 2026), calibrated against known sighting rates. Figures are rounded to the nearest 10% because citizen-science data supports honest approximations, not decimals, and months with records from fewer than five people show "—". How it works.