Killdeer

Killdeer

Charadrius vociferus

Silhouette: Andy Wilson · PhyloPic

LCNTNear ThreatenedVUENCR
Daily sighting probability ~20% · Possible
at Detroit

In 3 days ~50% in a week ~80%

1,978 Verified sightings at Detroit
19,653 In all 52 parks From 2019 to 2026
July Best month
☀️ Diurnal When it's spotted

About the Killdeer

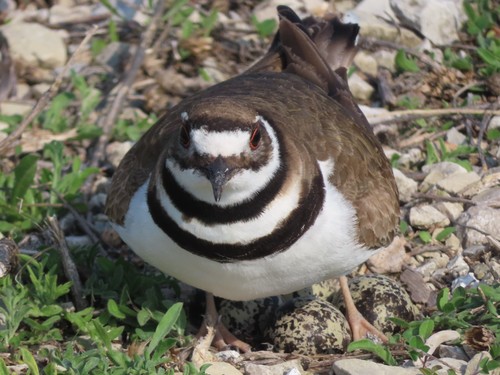
The killdeer (Charadrius vociferus) is a large plover found in the Americas. Its shrill, two-syllable call is often heard, sounding like "kill deer". It was described and given its current scientific name in 1758 by Carl Linnaeus in the 10th edition of his Systema Naturae. Three subspecies are described. Its upperparts are mostly brown with rufous fringes, the head has patches of white and black, and two black bands cross the breast. The belly and the rest of the breast are white. The nominate (or originally described) subspecies breeds from southeastern Alaska and southern Canada to Mexico. North American breeders winter from their resident range south to Central America, the West Indies, and the northernmost portions of South America.

The nonbreeding habitat of the killdeer includes coastal wetlands, beach habitats, and coastal fields. Its breeding grounds are generally open fields with short vegetation (but locations such as rooftops are sometimes used); although it is a shorebird, it does not necessarily nest close to water. The nest itself is a scrape lined with vegetation and white material, such as pebbles or seashell fragments. This bird lays a clutch of four to six buff to beige eggs with dark markings. The breeding season (starting with egg-laying) occurs from mid-March to August, with later timing of egg-laying in the northern portion of the range. Both parents incubate the eggs for 22 to 28 days typically. The young stay in the nest until the day after being hatched, when they are led by their parents to a feeding territory (generally with dense vegetation where hiding spots are abundant), where the chicks feed themselves. The young then fledge about 31 days after hatching, and breeding first occurs after one year of age.

The killdeer primarily feeds on insects, although other invertebrates and seeds are eaten. It forages almost exclusively in fields, especially those with short vegetation and with cattle and standing water. It primarily forages during the day, but in the nonbreeding season, when the moon is full or close to full, it forages at night, likely because of increased insect abundance and reduced predation during the night. Predators of the killdeer include various birds and mammals. Wikipedia →
Sounds

Song0:20

United States · 2026

© Rory Nefdt · XC1146761 · CC BY-NC-SA 4.0

Alarm call0:23

Canada · 2023

© Tom Cooney · XC1103909 · CC BY-NC-SA 4.0

Flight call0:09

United States · 2025

© David Tattersley · XC1000428 · CC BY-NC-SA 4.0

Global Distribution

Parks Where Found

# Park Country Daily sighting probability
1 Badlands National Park 🇺🇸 United States
~30%
2 Pacific Rim National Park Reserve 🇨🇦 Canada
~30%
3 Merritt Island National Wildlife Refuge 🇺🇸 United States
~30%
4 Yellowstone National Park 🇺🇸 United States
~30%
5 El Vizcaíno Biosphere Reserve 🇲🇽 Mexico
~30%
6 Point Pelee National Park 🇨🇦 Canada
~30%
7 Ciénaga de Zapata 🇨🇺 Cuba
~30%
8 Isla del Coco National Park 🇨🇷 Costa Rica
~30%
9 Big Cypress National Preserve 🇺🇸 United States
~20%
10 Death Valley National Park 🇺🇸 United States
~20%
11 Everglades National Park 🇺🇸 United States
~20%
12 Los Haitises National Park 🇩🇴 Dominican Republic
~20%
13 Bahía de Loreto National Park 🇲🇽 Mexico
~20%
14 Great Bear Rainforest 🇨🇦 Canada
~20%
15 Channel Islands National Park 🇺🇸 United States
~10%
16 Elk Island National Park 🇨🇦 Canada
~10%
17 Cabo Pulmo National Park 🇲🇽 Mexico
~10%
18 Jaragua National Park 🇩🇴 Dominican Republic
~10%
19 Celestún Biosphere Reserve 🇲🇽 Mexico
~10%
20 Big Bend National Park 🇺🇸 United States
~10%
21 Redwood National Park 🇺🇸 United States
~10%
22 Ría Lagartos Biosphere Reserve 🇲🇽 Mexico
~10%
23 Padre Island National Seashore 🇺🇸 United States
~10%
24 Grand Teton National Park 🇺🇸 United States
~10%
25 Great Smoky Mountains National Park 🇺🇸 United States
~10%
26 Riding Mountain National Park 🇨🇦 Canada
~10%
27 Joshua Tree National Park 🇺🇸 United States
<5%
28 Arrecifes de Cozumel National Park 🇲🇽 Mexico
<5%
29 Calakmul Biosphere Reserve 🇲🇽 Mexico
<5%
30 Banff National Park 🇨🇦 Canada
<5%
31 Olympic National Park 🇺🇸 United States
<5%
32 Shenandoah National Park 🇺🇸 United States
<5%
33 Jasper National Park 🇨🇦 Canada
<5%
34 Montes Azules Biosphere Reserve 🇲🇽 Mexico
<5%
35 Congaree National Park 🇺🇸 United States
<5%
36 Yosemite National Park 🇺🇸 United States
<5%
37 Biotopo Cerro Cahuí 🇬🇹 Guatemala
<5%
38 Saguaro National Park 🇺🇸 United States
<5%
39 Palo Verde National Park 🇨🇷 Costa Rica
<5%
40 Voyageurs National Park 🇺🇸 United States
<5%
41 Santa Rosa National Park 🇨🇷 Costa Rica
<5%
42 Grand Canyon National Park 🇺🇸 United States
<5%
43 Cumbres de Monterrey National Park 🇲🇽 Mexico
<5%
44 Glacier National Park 🇺🇸 United States
<5%
45 Zion National Park 🇺🇸 United States
<5%
46 Rocky Mountain National Park 🇺🇸 United States
<5%
47 Acadia National Park 🇺🇸 United States
<5%
48 Carara National Park 🇨🇷 Costa Rica
<5%
49 Tortuguero National Park 🇨🇷 Costa Rica
<5%
50 La Amistad International Park (Panama) 🇵🇦 Panama
<5%
51 Tapantí-Macizo de la Muerte National Park 🇨🇷 Costa Rica
<5%
52 Arenal Volcano National Park 🇨🇷 Costa Rica
<5%

Cities Where Found

# City Country Daily sighting probability
1 Mesa 🇺🇸 United States
~50%
2 León 🇲🇽 México
~40%
3 Toluca 🇲🇽 México
~30%
4 Havana 🇨🇺 Cuba
~30%
5 Sacramento 🇺🇸 United States
~30%
6 Los Angeles 🇺🇸 United States
~20%
7 Denver 🇺🇸 United States
~20%
8 Chicago 🇺🇸 United States
~20%
9 Detroit 🇺🇸 United States
~20%
10 Las Vegas 🇺🇸 United States
~20%

Zoos & Centres Where Found

# Zoo / Centre Country
1 Living Desert Zoo and Gardens 🇺🇸 United States In captivity
2 Columbus Zoo and Aquarium 🇺🇸 United States In captivity
3 Phoenix Zoo 🇺🇸 United States In captivity
4 Oklahoma City Zoo and Botanical Garden 🇺🇸 United States In captivity
5 Arizona-Sonora Desert Museum 🇺🇸 United States In captivity
6 Aquarium of the Pacific 🇺🇸 United States In captivity
7 Monterey Bay Aquarium 🇺🇸 United States In captivity
8 Ralph Perkins II Wildlife Center and Woods Garden 🇺🇸 United States In captivity
9 Seattle Aquarium 🇺🇸 United States In captivity
10 Montreal Biodome 🇨🇦 Canada In captivity
11 Seattle Marine Aquarium 🇺🇸 United States In captivity

Before you go

What are the chances of seeing a Killdeer in Detroit?

Possible

About 20% of wildlife watchers report a Killdeer sighting in Detroit on a given day, based on 1,978 verified sightings from GBIF citizen-science data. It is the 27th most-seen of the 199 birds we can rate there. Over three days the chance rises to about 50%, and over a week to about 80%, if each day is a fresh chance.

When is the best time to see a Killdeer in Detroit?

March–April and June–July

In those months about 30% of wildlife watchers report a Killdeer in Detroit on a given day, against under 5% in December to February, the lowest months.

What time of day is best to see a Killdeer?

Between 3 and 6 pm

Across all the parks we cover, that three-hour window holds the most Killdeer sightings with a recorded time, and about 9 in 10 of them come between 6 am and 6 pm: it is a daytime animal.

Is Detroit the best place to see a Killdeer?

9th of 48

Of the 48 cities where we can rate Killdeer sightings, Detroit ranks 9th at about 20%. The best odds are in Mesa (United States, about 50%), León (México, about 40%) and Toluca (México, about 30%).

Which relatives of the Killdeer live in Detroit?

Same order: Charadriiformes

The closest relatives of the Killdeer that you can see in Detroit (order Charadriiformes, Shorebirds and Allies) are Ring-billed Gull (about 30%) and American Herring Gull (about 10%), with each one's daily chance of a sighting.

Where does the Killdeer sighting chance come from?

GBIF citizen-science records

It is estimated from how often the Killdeer is recorded against all the birds logged in Detroit (1,978 verified sightings), calibrated against known sighting rates. Figures are rounded to the nearest 10% because citizen-science data supports honest approximations, not decimals, and months with records from fewer than five people show "—". How it works.

← Back to Detroit