| 1 | Saguaro National Park | 🇺🇸 United States | | |
|  Curve-billed Thrasher | |
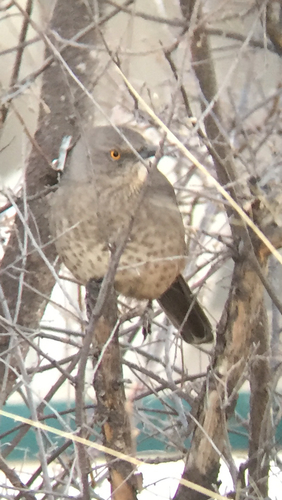
|  Crissal Thrasher | |
|  Bendire's Thrasher | |
| 2 | Cabo Pulmo National Park | 🇲🇽 Mexico | | |
|  Gray Thrasher | |
| 3 | Big Bend National Park | 🇺🇸 United States | | |
| Curve-billed Thrasher | |
| Crissal Thrasher | |
|  Brown Thrasher | |
|  Long-billed Thrasher | |
| 4 | Cumbres de Monterrey National Park | 🇲🇽 Mexico | | |
| Long-billed Thrasher | |
| Curve-billed Thrasher | |
| 5 | Reserva de la Biosfera Mariposa Monarca | 🇲🇽 Mexico | | |
| Curve-billed Thrasher | |
| 6 | Badlands National Park | 🇺🇸 United States | | |
| Brown Thrasher | |
| 7 | El Vizcaíno Biosphere Reserve | 🇲🇽 Mexico | | |
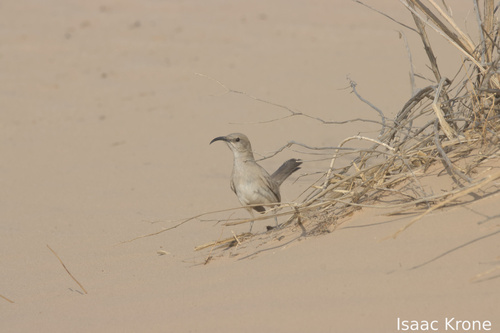
|  Le Conte's Thrasher | |
| Gray Thrasher | |
| 8 | Bahía de Loreto National Park | 🇲🇽 Mexico | | |
| Gray Thrasher | |
| 9 | Joshua Tree National Park | 🇺🇸 United States | | |
|  California Thrasher | |
| Le Conte's Thrasher | |
| 10 | Guadalupe Mountains National Park | 🇺🇸 United States | | |
| Curve-billed Thrasher | |
| Crissal Thrasher | |
| Brown Thrasher | |
| 11 | Death Valley National Park | 🇺🇸 United States | | |
| Crissal Thrasher | |
| Le Conte's Thrasher | |
| Brown Thrasher | |
| 12 | Shenandoah National Park | 🇺🇸 United States | | |
| Brown Thrasher | |
| 13 | Point Pelee National Park | 🇨🇦 Canada | | |
| Brown Thrasher | |
| 14 | Great Smoky Mountains National Park | 🇺🇸 United States | | |
| Brown Thrasher | |
| 15 | Congaree National Park | 🇺🇸 United States | | |
| Brown Thrasher | |
| 16 | Everglades National Park | 🇺🇸 United States | | |
| Brown Thrasher | |
| 17 | Merritt Island National Wildlife Refuge | 🇺🇸 United States | | |
| Brown Thrasher | |
| 18 | Sequoia and Kings Canyon National Parks | 🇺🇸 United States | | |
| California Thrasher | |
| 19 | Big Cypress National Preserve | 🇺🇸 United States | | |
| Brown Thrasher | |
| 20 | Riding Mountain National Park | 🇨🇦 Canada | | |
| Brown Thrasher | |
| 21 | Grand Canyon National Park | 🇺🇸 United States | | |
| Crissal Thrasher | |
| 22 | Acadia National Park | 🇺🇸 United States | | |
| Brown Thrasher | |
| 23 | Channel Islands National Park | 🇺🇸 United States | | |
| California Thrasher | |
| 24 | Zion National Park | 🇺🇸 United States | | |
| Crissal Thrasher | |
| 25 | Yosemite National Park | 🇺🇸 United States | | |
| California Thrasher | |
| 26 | Rocky Mountain National Park | 🇺🇸 United States | | |
| Brown Thrasher | |