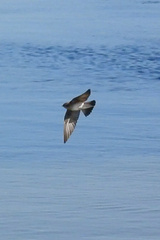
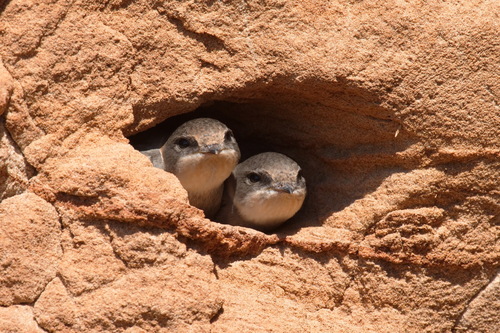
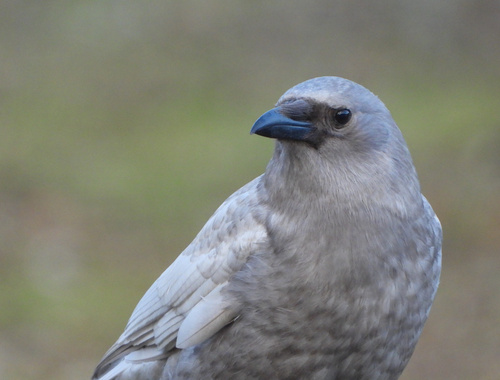
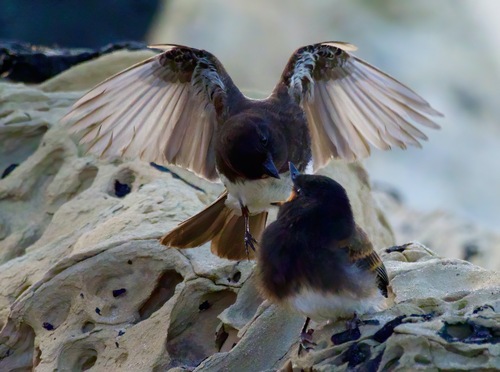
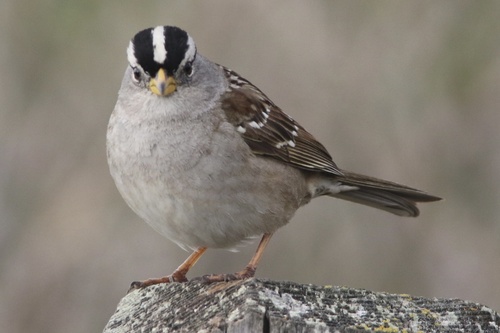
What are the chances of seeing a Northern Rough-winged Swallow in San Francisco?
With luck
About 10% of wildlife watchers report a Northern Rough-winged Swallow sighting in San Francisco on a given day, based on 5,667 verified sightings from GBIF citizen-science data. It is the 116th most-seen of the 375 birds we can rate there. Over three days the chance rises to about 20%, and over a week to about 30%, if each day is a fresh chance.
When is the best time to see a Northern Rough-winged Swallow in San Francisco?
April to June
In those months about 20% of wildlife watchers report a Northern Rough-winged Swallow in San Francisco on a given day, against under 5% in August to February, the lowest months. Those are among San Francisco's driest months, with about 20 mm of rain a month against 110 mm in December.
What time of day is best to see a Northern Rough-winged Swallow?
Between 7 and 10 am
Across all the parks we cover, that three-hour window holds the most Northern Rough-winged Swallow sightings with a recorded time, and about 9 in 10 of them come between 6 am and 6 pm: it is a daytime animal.
Is San Francisco the best place to see a Northern Rough-winged Swallow?
25th of 46
Of the 46 cities where we can rate Northern Rough-winged Swallow sightings, San Francisco ranks 25th at about 10%. The best odds are in Mesa (United States, about 30%), Tegucigalpa (Honduras, about 30%) and León (México, about 20%).
Which relatives of the Northern Rough-winged Swallow live in San Francisco?
Same family: Hirundinidae
The closest relatives of the Northern Rough-winged Swallow that you can see in San Francisco (family Hirundinidae, Swallows and Martins) are Barn Swallow (about 10%), Violet-green Swallow (about 10%) and Tree Swallow (about 10%), with each one's daily chance of a sighting.
Where does the Northern Rough-winged Swallow sighting chance come from?
GBIF citizen-science records
It is estimated from how often the Northern Rough-winged Swallow is recorded against all the birds logged in San Francisco (5,667 verified sightings), calibrated against known sighting rates. Figures are rounded to the nearest 10% because citizen-science data supports honest approximations, not decimals, and months with records from fewer than five people show "—". How it works.